Mayo Clinic-Arizona Medicare Revenue per Patient Day is 20% higher than State averages
Get Dexur’s Personalized Hospital Specific Presentation on Quality, Safety, Compliance & Education
By: Emily Carpintero Dec. 08, 2017
Dexur’s analysis of the most recently available CMS data (January - December 2016) shows that Mayo Clinic-Arizona’s revenue per patient day was 19.36% higher than the state’s average and 30.87% higher than the nation’s average. Dexur identified Medicare inpatients’ total payments, total days, and total payments per day at the national, state, and individual hospital level. These metrics are commonly used to compare cost of care across the country. Below is a graph highlighting the highest revenue categories in Mayo Clinic-Arizona and the payment per day for each category at the hospital, state and national level.
Percentage of Revenue per Patient Day
for 6 Categories at the Hospital, State & National Level
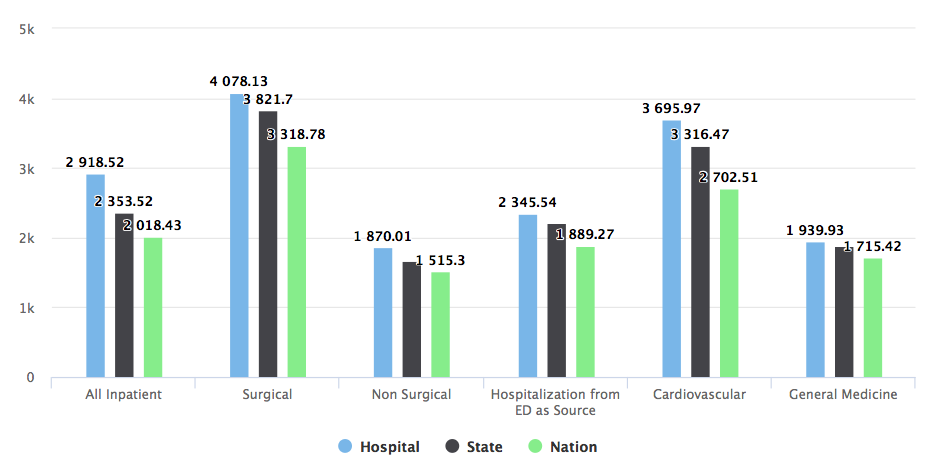
The hospital’s surgical payments from Medicare totaled to nearly 72 million dollars. This covered 17,647 total days of hospitalization, averaging a cost of $4,078 per day per Medicare inpatient. This was higher than the state and national averages for payment per day by 6.28% and 18.61%, respectively. The non-surgical discharges accounted for over 36 million dollars from Medicare payments. This covered 19,517 total days of hospitalization, which averaged to a cost of $1,870 per day. This average was higher than the state and national averages for payment per day in this category by 11.18% and 18.98%, respectively. Inpatient hospitalizations from the ED as the source of admission accounted for over 42 million dollars in Medicare payments. This covered 17,914 total days of hospitalization, which averaged to a cost of $2,346 per day. This was 5.97% higher than the state and 19.48% higher than the national averages for payment per day in this category.
Mayo Clinic-Arizona is part of a non-profit healthcare system and was the second highest volume discharging hospital for Medicare inpatients in Arizona between January and December 2016, according to Dexur’s data. The Mayo Clinic Health System has a high concentration on quality of care. They measure quality care according to mortality rates, surgical infection rates, compliance with widely used processes attributing to enhancement of care, volume of patients with complex diagnoses, the institution’s safety record and time spent with each patient. The health system aims to be in the top 10% in the nation for performance of all quality of measures. This commitment to high quality of patient care could result in more use of screenings, tests and treatments to avoid any unforeseen poor clinical outcomes, ultimately causing the cost of care per day to be higher in comparison to other facilities.
| Category | Total Hospital Payments | Total Hospital Days | Hospital Payments per Day | State Payments per Day | National Payments per Day |
|---|---|---|---|---|---|
| All-Inpatient | $10,463,812 | 37,164 | $2,919 | $2,354 | $2,018 |
| Surgical | $71,966,773 | 17,647 | $4,078 | $3,822 | $3,319 |
| Hospitalization from ED as Source | $42,018,046 | 17,914 | $2,346 | $2,206 | $1,889 |
| Non-Surgical | $36,497,039 | 19,517 | $1,870 | $1,661 | $1,515 |
DEXUR PRO MEMBERS GET ACCESS TO:
- Total payments from Medicare inpatients, their total days hospitalized and their total payments per day at Mayo Clinic-Arizona for each hospital category
- Total payments per day for each hospital category at the state and national level
ABOUT THE AUTHOR