Disease Burden Data & Dashboards | Back to Life Sciences Data Suite
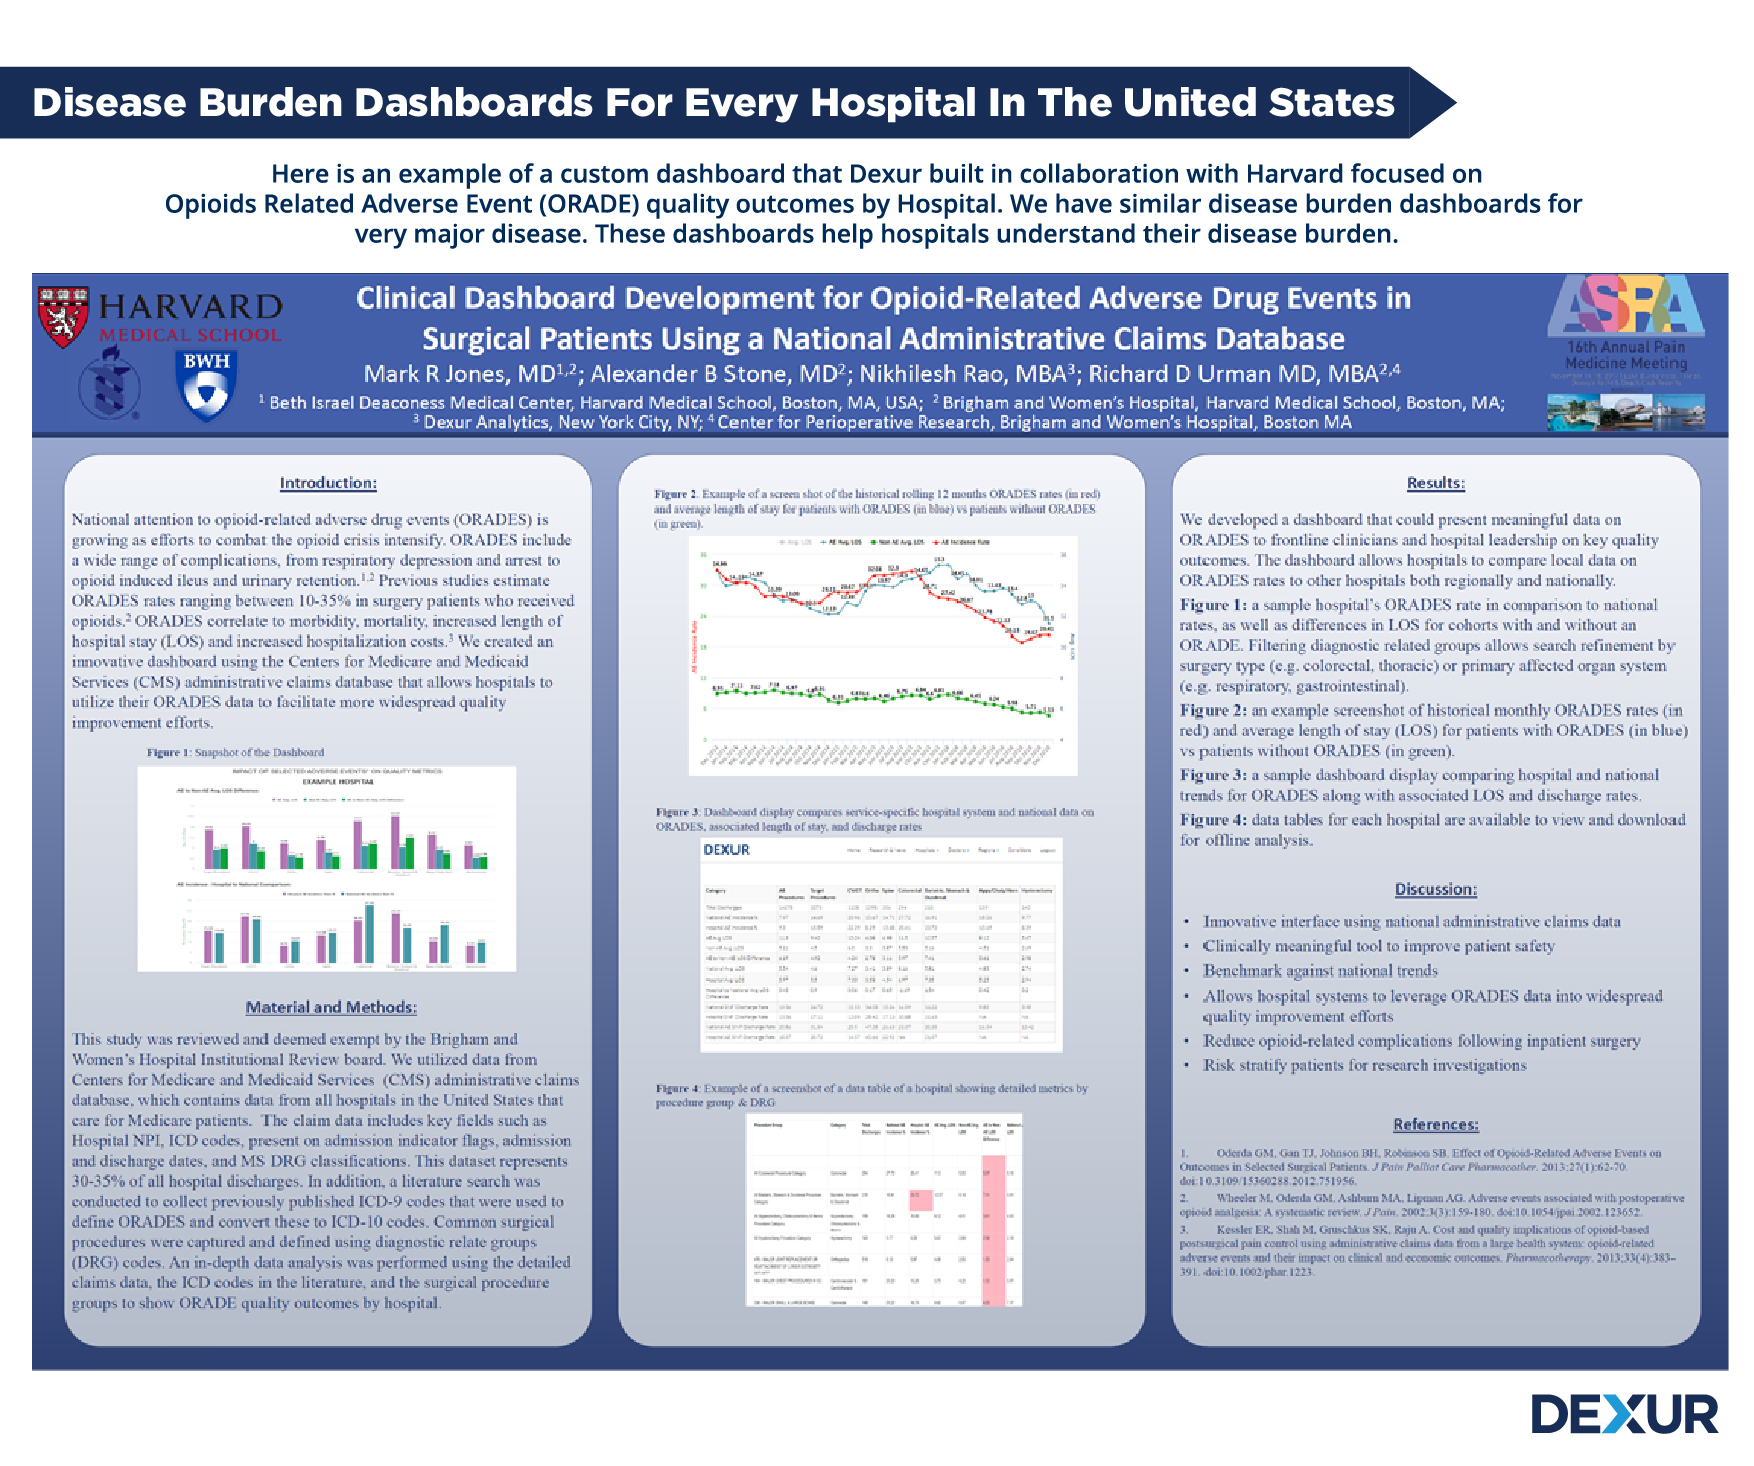
Dexur utilizes its anonymized claims database to build disease burden data & dashboards at the national, regional, and hospital level. The outcomes for a specific disease (e.g., Diabetes, Chronic Kidney Disease) include the total cost of care, readmission, mortality, nursing home costs, length of stay, and any metric relevant to the disease.


DISEASE BURDEN OUTCOMES THAT MATTER TO PHYSICIANS, HOSPITALS, ACOs & PAYORS
Value Outcomes / Cost of Care Per Episode: Cost of care over an episode includes index hospitalization, readmissions, nursing home, home health and ED costs.
Mortality: Analyzed through the discharge status on the claim record. The lower the mortality within the hospital, the better the quality outcomes.
Length of Stay (LOS): Describes the duration of a single episode of hospitalization. Inpatient days are calculated by subtracting day of admission from day of discharge. All else being equal, the lower the LOS, the better it is for the hospital.
30 Day Readmissions: 30 Day readmissions are calculated by tracking the patient at the point of discharge to readmissions at any hospital within 30 days. Medicare and other payors are penalizing / incentivizing hospitals who have higher/lower 30 day readmissions.
ICU Stay: ICU stays are gleaned by analyzed the service utilization on claim records. ICU stays are important because time in the ICU is way costlier than in the regular room.
Revenue per Day: Revenue per day is the total payments paid by Medicare divided by the total days in hospital for that conditions. Hospitals & Investors closely watch that number to understand economic efficiency?
HOW DEXUR DISEASE BURDEN DATA & RESEARCH ARE USED
Analytics, Research Targeting, Planning & Forecasting: Sales, planning & management can use the data to help identify key targets within a territory, district & region and to forecast future opportunities
Marketing: Marketing can use the data to identify key trends among different customer segments & align messaging based on trends.
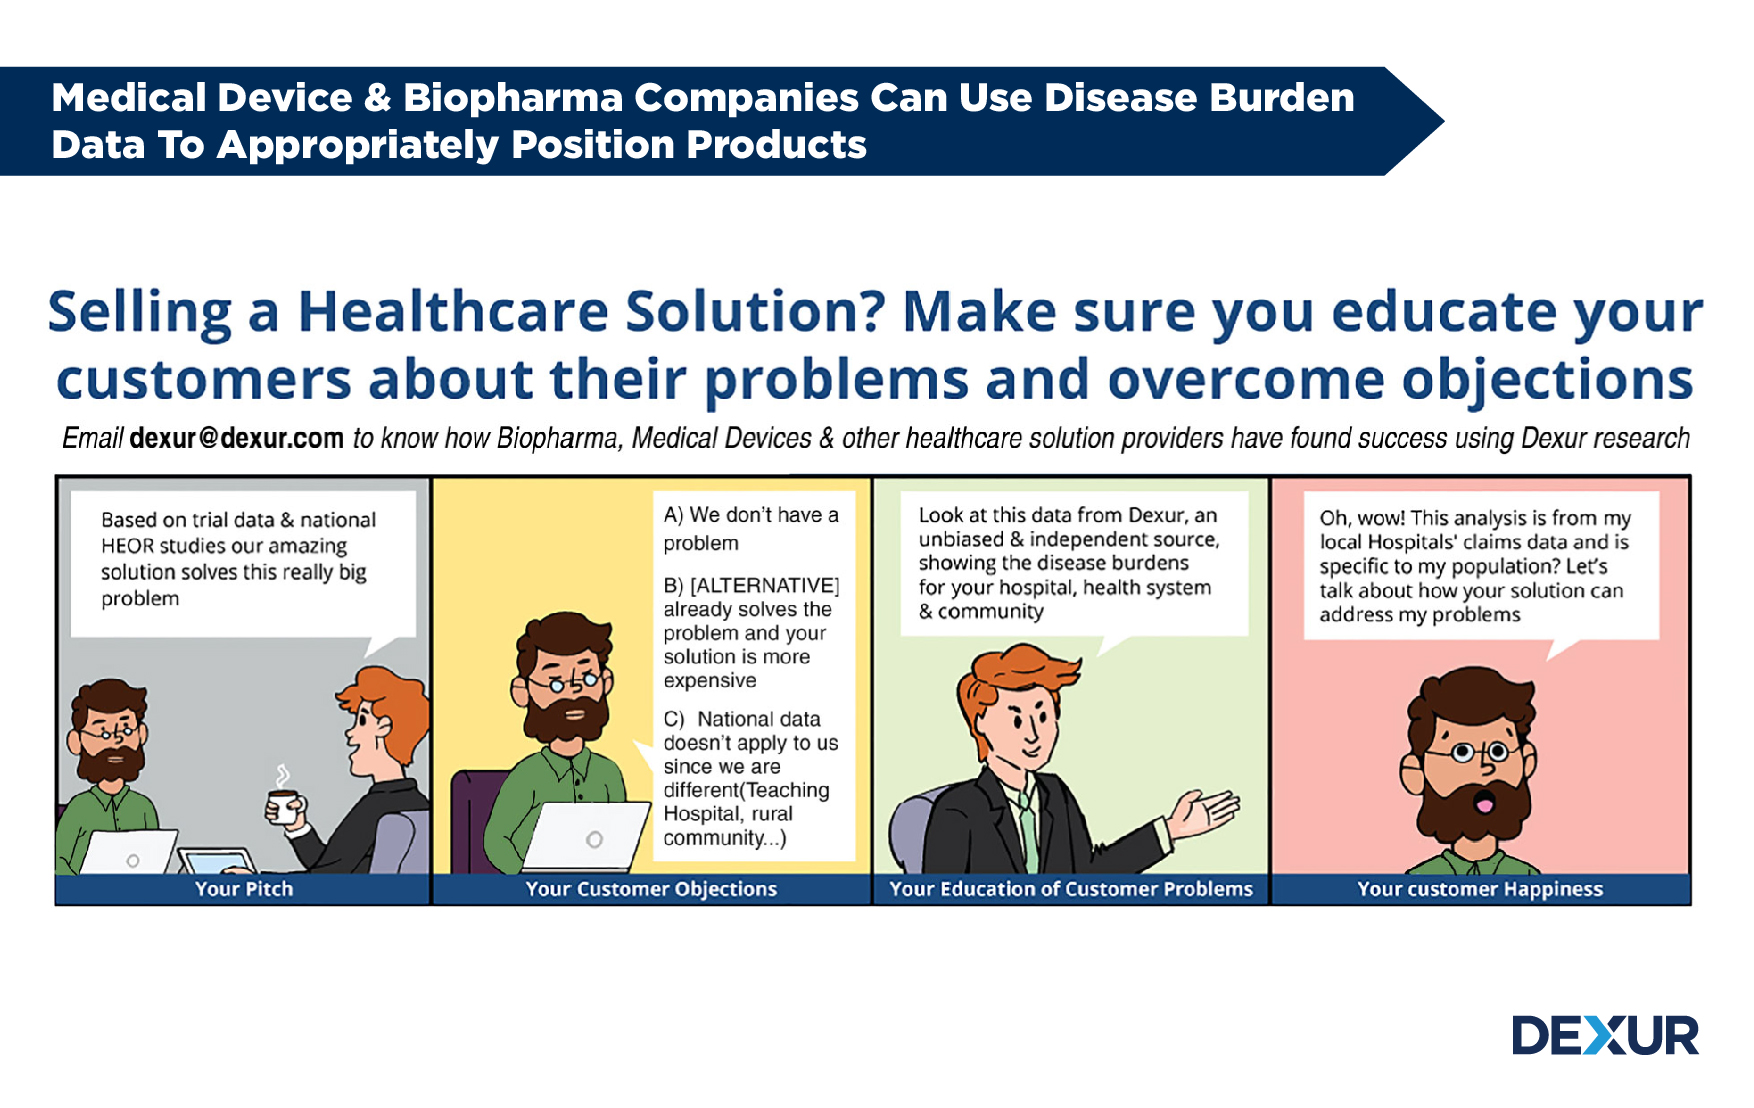
Sales: will have the capability to utilize Hospital specific data to augment discussions with clinicians, P&T, Quality & C-suite.
Market Access (Payors, IDNs & ACOs): Payors (outside of hospitals) can estimate overall hospitalization costs & drive adoption of therapies. The IDN / Health System teams can utilize data & dashboard to demonstrate regional /hospital performance/outcomes within a health system to gain alignment between the IDN & hospital. They can also present a system approach to aligning with the Triple Aim.
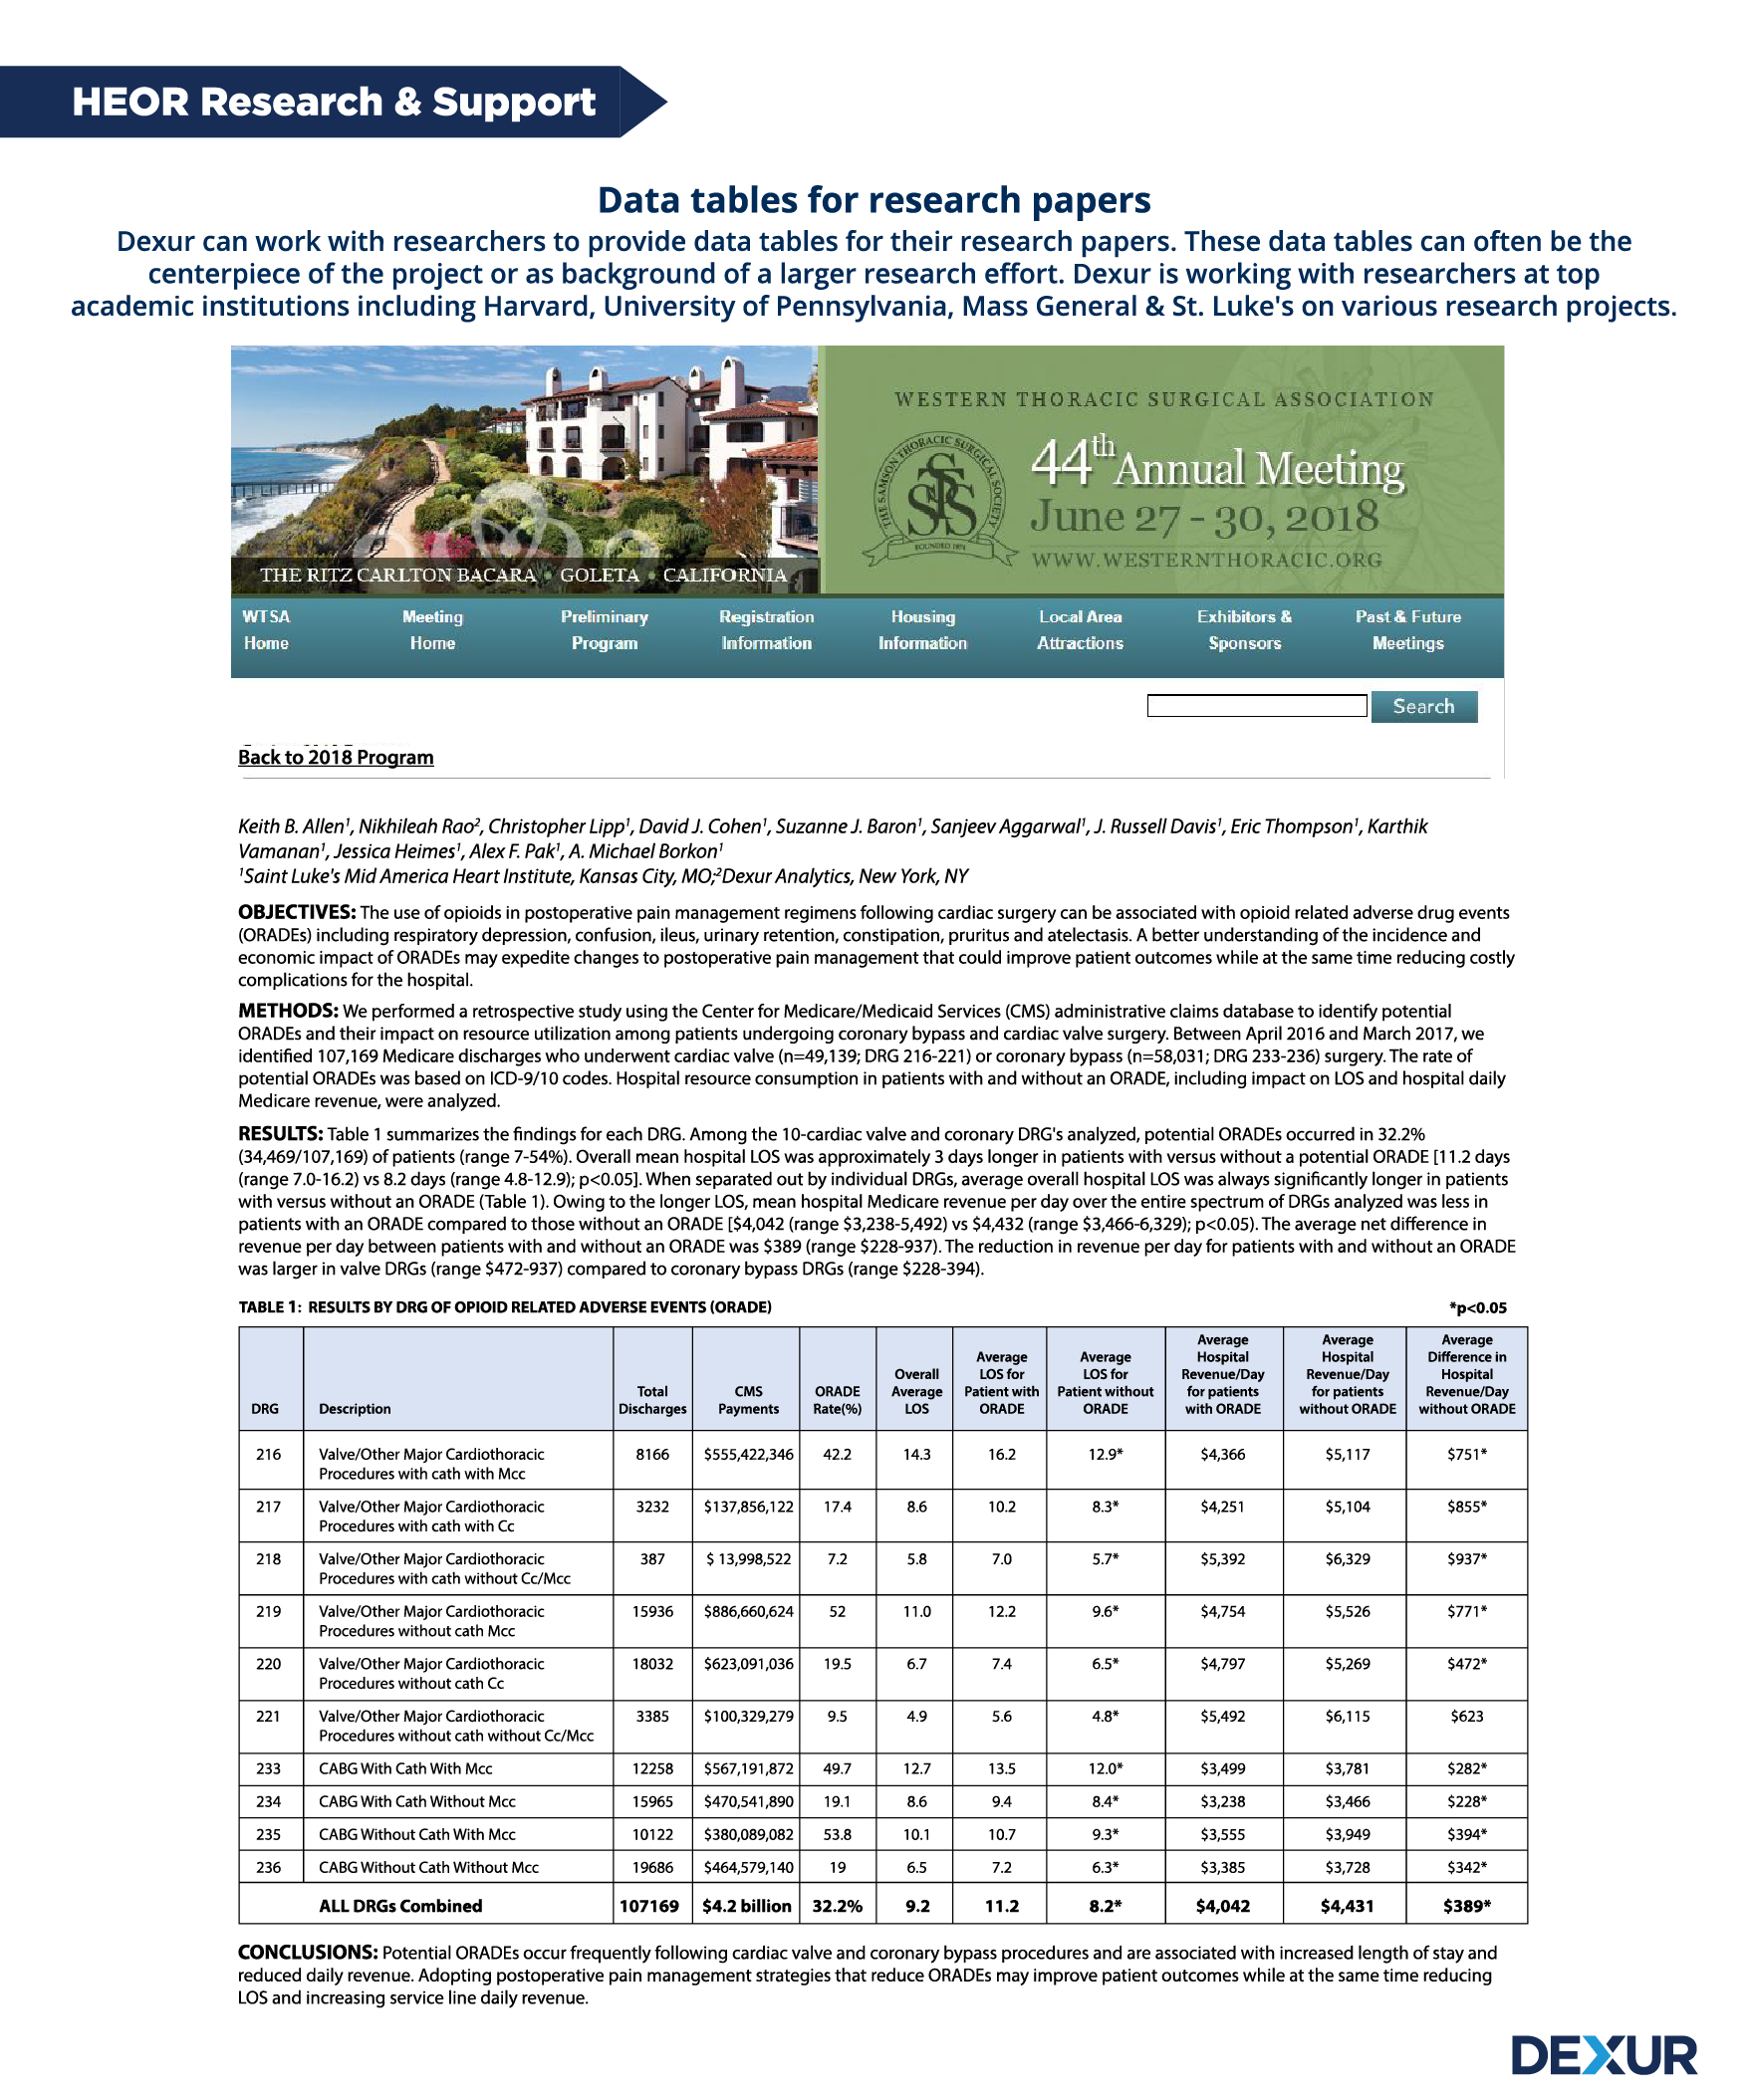
MSL & HEOR: The MSL team can use the data as a resource with key physician groups. HEOR teams can use the data to understand key disease burden data.
KOLs: KOLs have the ability to use this research to evaluate the cost & impact of their individual hospitals and key conditions and use this to present to Senior Leadership to justify their position. They could also work with Dexur to publish findings.