Hospital Size Drives Inverse Correlation Between Length of Stay and 30-Day Readmissions for Heart Failure Patients in Missouri
In Heart Failure
Get Dexur’s Personalized Hospital Specific Presentation on Quality, Safety, Compliance & Education
By: James Pitt May. 11, 2018
The Center for Medicare and Medicaid Services (CMS) uses average length of stay (LOS) and 30-day readmission rates as measures of hospital quality. However, improving one measure may come at the expense of the other. A 2013 international study of 6848 heart failure patients found that LOS and readmissions were inversely correlated in their study population.
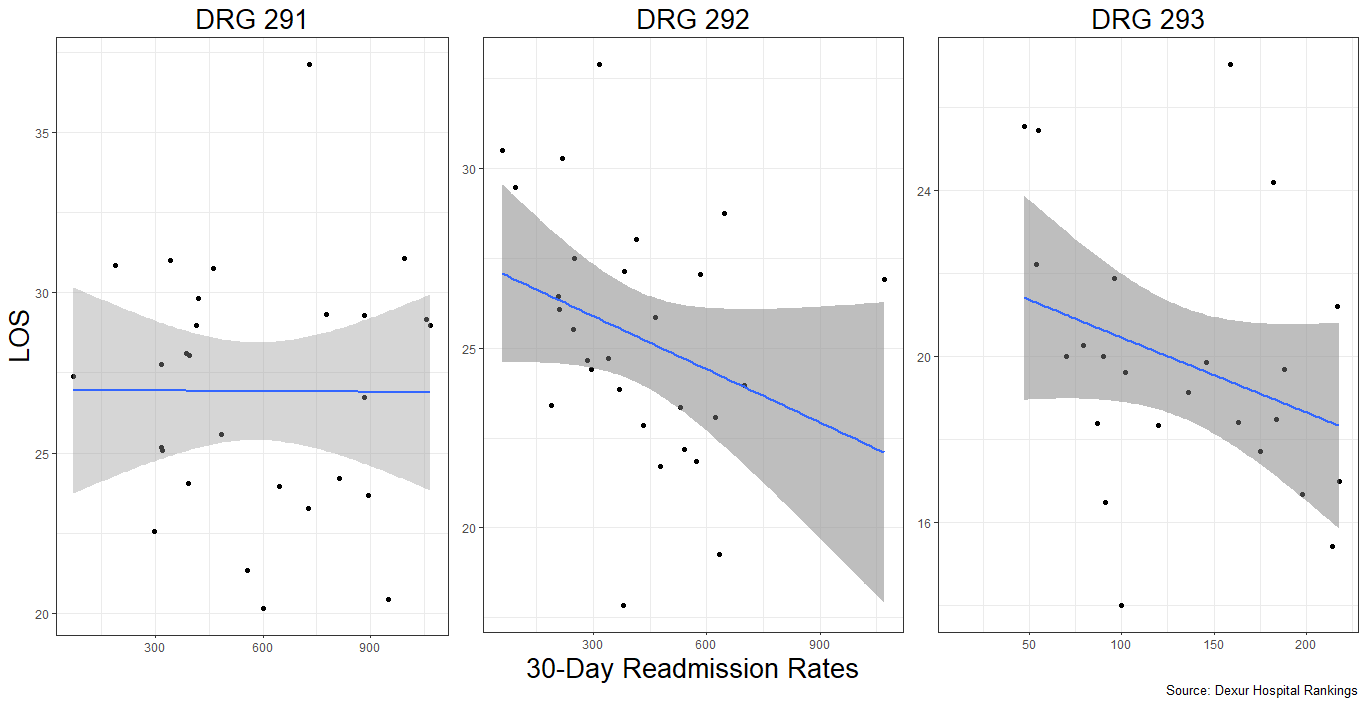
Dexur analysts used top-ranked hospitals in Missouri to investigate this relationship. Data came from the 28 hospitals in Missouri with the highest total heart failure discharges among CMS inpatients from 2013-2016. In this sample, LOS and 30-day readmission rates did indeed inversely correlate for DRG 292 and 293.
| DRG 291 (Heart failure and shock with major comorbidities or complications) | DRG 292 (Heart failure and shock with comorbidities or complications) | DRG 293 (Heart failure and shock without comorbidities or complications) | |
|---|---|---|---|
| Correlation between LOS and 30-day readmission rate | -0.00748071 | -0.2499937 | -0.2719956 |
These correlations appeared to stem from a stronger underlying relationship with hospital size. In this population, a hospital’s total Medicare discharges had a negative correlation with 30-day heart failure readmissions and a positive correlation with average length of stay for heart failure patients. It is possible that smaller hospitals are swifter to discharge patients compared to larger hospitals, leading to a lower length of stay but higher readmission rates.
Such a “judgment call” effect could account for why DRG 291 did not show the clear inverse correlation that DRGs 292 and 293 did. DRG 291 patients may be ill enough that there is less ambiguity in when they have recovered than for DRG 292 and DRG 293 patients.
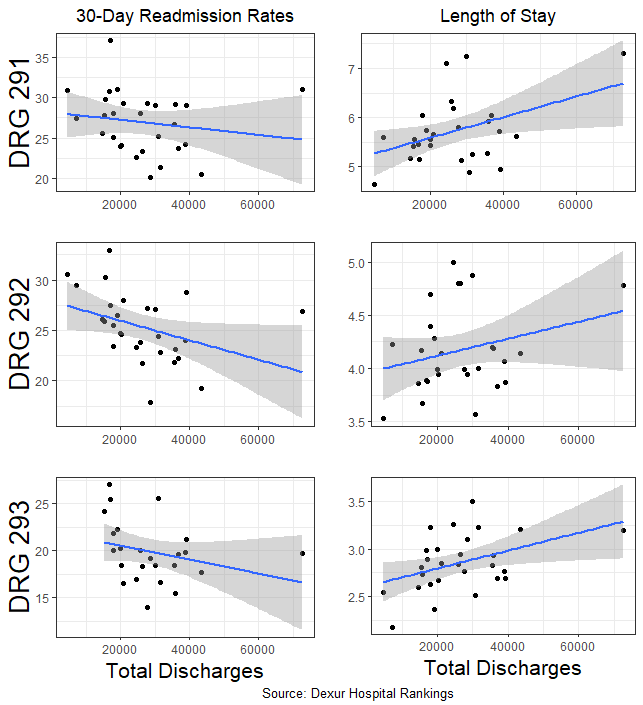
| Correlations with total discharges | DRG 291 | DRG 292 | DRG 293 |
|---|---|---|---|
| Readmission rate | -0.1613165 | -0.3760379 | -0.2855488 |
| Length of stay | 0.4223191 | 0.2645589 | 0.4221759 |
Within each DRG, there was less variation. DRG 291 discharges did not correlate with 30-day readmission rates or LOS. However, DRG 292 and DRG 293 discharges had stronger correlations with these quality metrics than total Medicare discharges did.
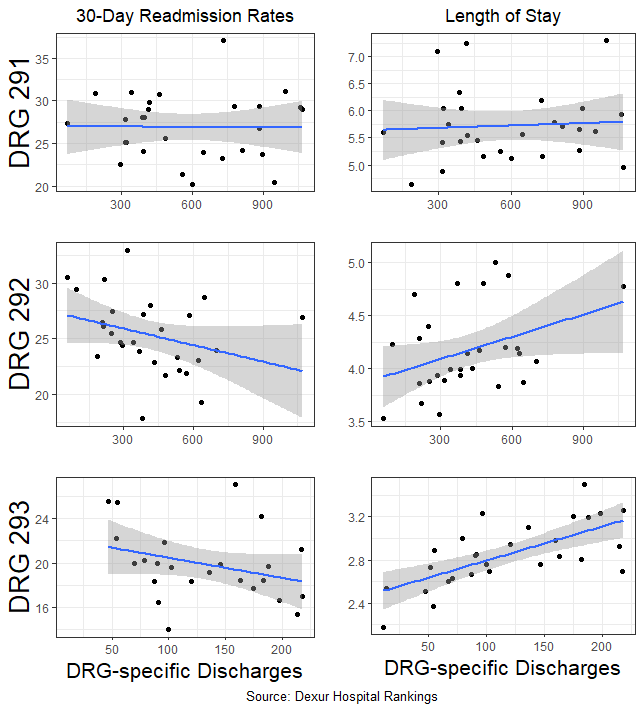
| Correlations with DRG-specific discharges | DRG 291 | DRG 292 | DRG 293 |
|---|---|---|---|
| Readmission rate | -0.004812903 | -0.3124417 | -0.3116132 |
| Length of stay | 0.06270594 | 0.3736099 | 0.6732931 |
DEXUR PRO MEMBERS GET ACCESS TO:
- Heart failure total discharges, average length of stay, average readmission rate at DRG level, and addresses for the 28 hospitals with the highest discharge volumes in Missouri: Barnes - Jewish Hospital, Boone Hospital Center, Centerpoint Medical Center, Christian Hospital, Cox Medical Center South, Freeman Hospital West, Mosaic Life Care at St. Joseph, Mercy Hospital Jefferson, Mercy Hospital Joplin, Mercy Hospital Springfield, Mercy Hospital St Louis, Missouri Baptist Medical Center, North Kansas City Hospital, Poplar Bluff Regional Medical Center - Oak Grove, St. Joseph Medical Center (Prime Healthcare Services Kansas City), Research Medical Center, Saint Francis Medical Center, Saint Lukes East Hospital, Saint Lukes Hospital of Kansas City, Southeast Hospital, SSM Health DePaul Hospital, St. Clare Hospital - Fenton, St. Joseph Hospital - St. Charles, SSM Health St. Mary's Hospital, SSM Health St. Louis University Hospital, St. Anthonys Medical Center, St Lukes Hospital, University Hospital
ABOUT THE AUTHOR